
STATISTICAL GRAPH
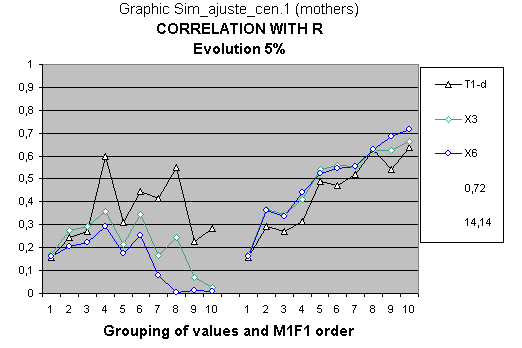
The title of each graph of the statistical study indicates the parents' variables (R or M & F) to which the correlations relate. Each point of the colored lines represents the correlations with the observational C variables of the children.
Likewise, the variables of unknown order, formed by the different groups of 1 to 10 values from the 70 IQ values of each parent and children variables, appear on the left-hand side of the graph. The criteria order of the groups of 1 to 10 values located on the right-hand side is the variable mentioned at the bottom of the graph.
Indeed, there is an almost instantaneous perception of the exactitude of the particular specification of the statistical study; each graph shows sixty coefficients of determination (r²) highlighting the global and underlying relations of the involved data set.
See the methodology of the statistical abstract for more details
STATISTICAL STUDY COMMENTS
1. General statistical significance
The considerable increase of the correlation for the estimation of homogenous groups is not due to the reduction of 68 to 5 or 4 degrees of freedom, since the estimation with non-homogenous groups, without previous rearrangement, has the same degrees of freedom and the correlation even lowers concerning the sample without grouping.
In general, the model of the genetic evolution of intelligence (Mendelian genetics – Conditional intelligence – Global Cognitive Theory) adjusts perfectly, showing an r² superior to 0.9 in several cases. Bearing in mind the tendency to increase the goodness of fit with the size of rearranged groups, we could assume it would be over 0,9 in almost all the cases for grander groups within a more significant sample.
2. The Global Model - Quantitative study on simulation of evolution with artificial IQ.
After introducing into the Social Model the functional limitations due to genetic problems, quantitative variables with random disturbances similar to the observed data, and 5% of internal evolution, the Global Model works satisfactorily.
The third surprise was that the complete model contains the same parameters as the billiards game Esnuka (1992) about the genetic problems regarding the nature of intelligence. Some of those problems were not in the initial model to simplify both its presentation and the statistical study.
The original individual variables do not always improve their adjustment within the statistical simulation of the Global Model, whereas the centered variables do. For rearrangement criterion (M+F)/2, it is obvious because this criterion does not respond to changes in the parameters of internal evolution.
3. Significant comments on this particular graph
As you can see by its form and its values, this graph is different from the other two with the same variables (Rm.cen.3 and Sim.cen.3), the difference is the effect on variables R y M1P1 due to the variation that evolution parameters ( ° ), which allows us to make the statistical analysis of the Globus Model.
The general multidimensional correlation index (MCIG) is 14,14 and goes to 14,98 and 15,61 respectively.
The highest determination coefficient r² of this graph is 0,72 and goes to 0,92 and 0,89 respectively.